THREE MTDNA HAPLOGROUP K PHYLOGENETIC CHARTS
I have
created three phylogenetic charts from the
high-resolution, or HVR1 plus HVR2, entries on MitoSearch
or the Haplogroup K Project website. Each chart shows one small part of the K haplogroup,
generally one of the subclades which are defined by
control-region mutations. I have followed the nomenclature used in Dr. Doron Behar's Ashkenazi mtDNA
paper at http://www.familytreedna.com/pdf/43026_doron.pdf That
is the standard being used by FTDNA in assigning subclades
to those taking full-sequence mtDNA tests. At present, the K project has 100
persons with high-resolution test results. MitoSearch
has more than 200 high-res K's. These numbers are in
the same range or better than the sample sizes of many scientific studies.
Neither population used has coding-region mutations, which are required to
fully designate subclades; but that should not matter
with the specific subclades being charted.
Instead
of using a specialized software such as Fluxus or Pajek, these charts were drawn "by hand" in
Microsoft PowerPoint. Generally, the charts read left-to-right. The white
circles represent beginning or branching points with no specific examples. The
size of the circles is somewhat proportional to the number of examples. The
three-letter country codes should mostly be obvious. The countries of origin
were taken from MitoSearch, the K website, or the K
Group Administrator's Page. Mutations listed are from the examples, except that
back mutations are my interpretations. My thanks to Ann
Turner for valuable comments on a couple of the charts.
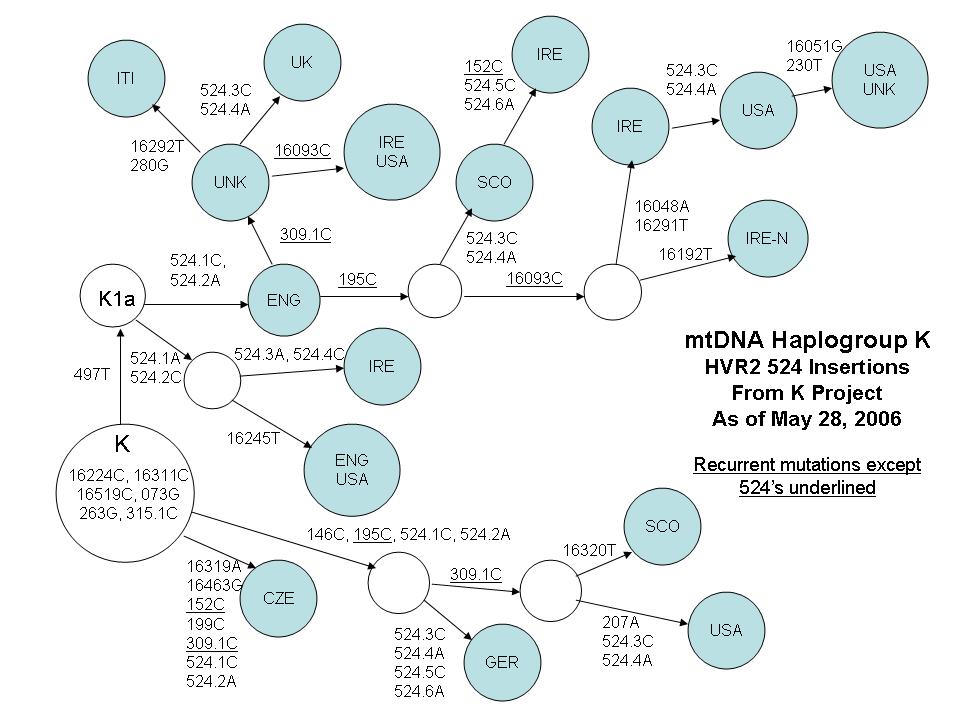
Chart
1 - HVR2 Position 524 Insertions
This
chart is based on the 20 haplotypes in the K project with insertions at HVR2
position 524. The 524 insertions always appear in pairs and thus, in my
opinion, each pair should be considered one mutation when calculating genetic
distances. Recurrent mutations are those which appear in more than one place in
the mtDNA tree, even within a haplogroup. As a result, most scientific studies,
including Behar's, ignore recurrent mutations.
Obviously, the 524's appear in numerous places in K. However, recurrent does
not mean random. I've pointed out before that I've never seen these in the
K1c/K1c2 or "Ashkenazi" subclades (see
charts 2 and 3). A glance at this chart shows that half the examples list one
of the British Isles countries as their maternal ancestors' origins. In
addition, all five of the ones listing USA were from a southeastern state -
those usually with English-Scots-Irish settlers. The one from Italy actually
listed Sicily. There is another example on MitoSearch
from Sicily. My guess: Normans. Note that the Czech example is remote from all
the other entries.
The
largest of four clusters on this chart is the top one, part of the top-level
K1a subclade with insertions starting with 524.1C. This one looks very British.
The next one down starts with 524.1A. As I have mentioned before, there is a
theory that the insertion sequences beginning with .1C and .1A are actually the
same thing counted two different ways. The next cluster lacks the 497T
mutation, which defines K1a, There are a couple of possible subclades
for those, but those would have to be determined by tests of coding-region
mutations. The last "cluster" is composed of only one entry listing
the Czech Republic.
Note the
great diversity on this chart; only three haplotypes have two examples. Also
note that there are two entries with six insertions. I have only seen one more
of those on the haplogroup I website. Don't bother looking for these on MitoSearch; it currently only accepts four insertions per
position.
Perhaps
the significance of this chart is that those K's with
these insertions who are brickwalled in the USA or
list Unknown should probably look to the British Isles for their maternal line.
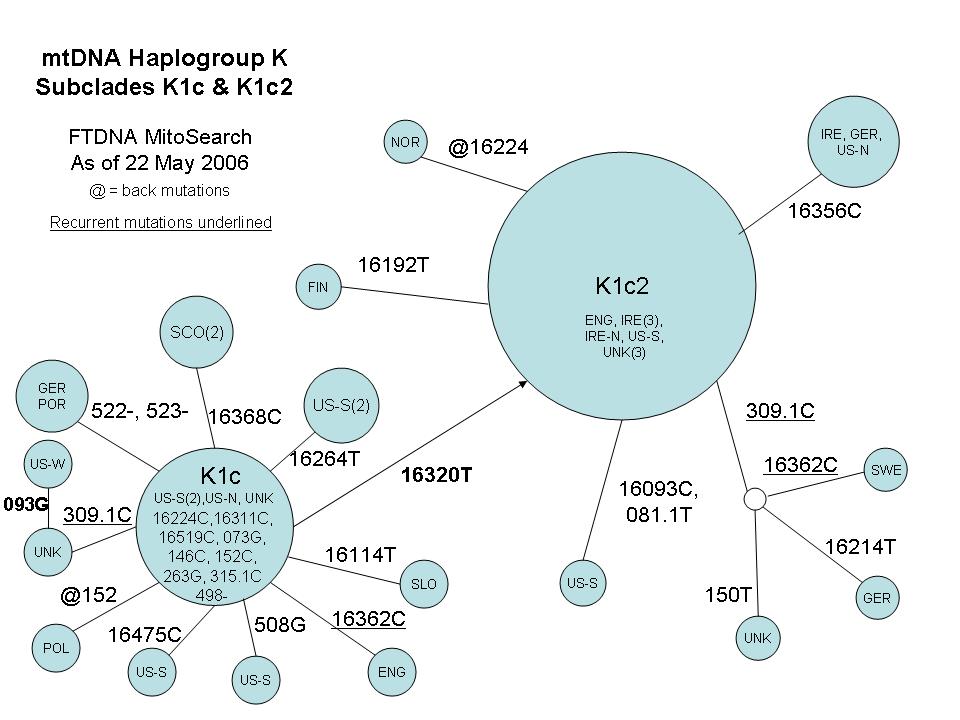
Chart 2
- Subclades K1c and K1c2
I will
confess a special interest in this chart since I'm on it. Subclade K1c is
defined by Behar by the 146C, 152C and 498- (deletion) mutations. K1c2 adds
16320T. (Since K1c1 is defined by coding-region mutations, some of the K1c’s
may actual belong to that lower subclade.) The chart is based on 35 entries
from MitoSearch, divided as equally as possible
between K1c and K1c2. Due to the method I used to extract the entries, I don't
guarantee that I picked up them all. I did check against my K500 survey chart
and the K project website. I used to refer to these as Scottish haplotypes,
then British, but now they seem to be scattered around Western Europe. I will
point out that the USA entries are mostly from the southeast or Pennsylvania,
also largely settled from the British Isles. The two large circles demonstrate
that there are relatively high numbers of "perfect" examples of the
two subclades, with "star" patterns leading
off from each.
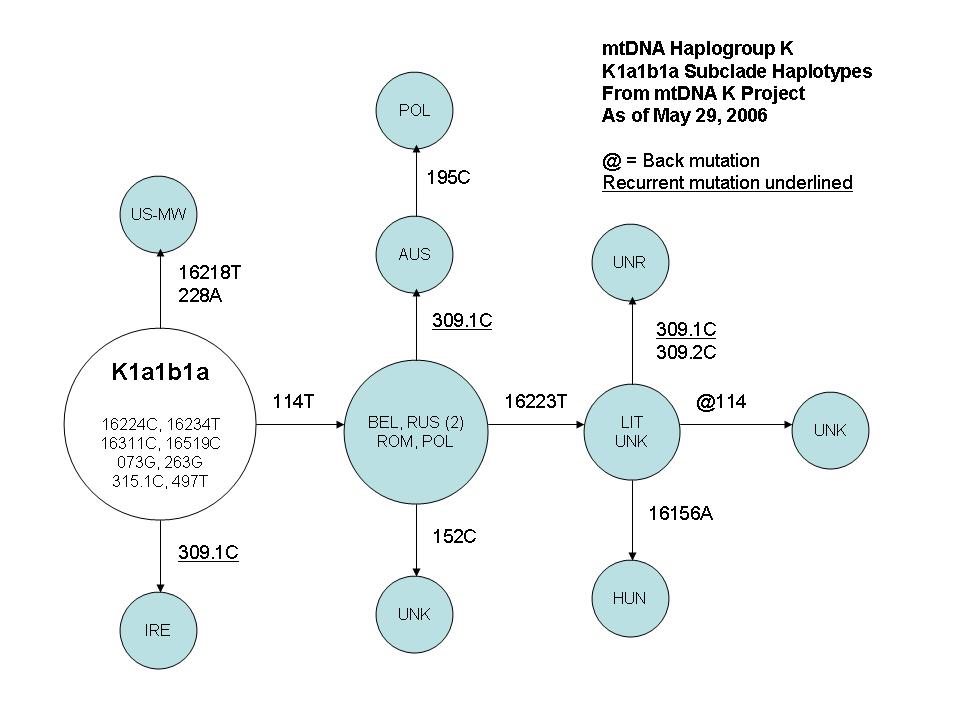
Chart
3 - Subclade K1a1b1a
Dr. Behar
defines K1a1b1a by 16234T. Below that he has 114T, then 16223T. Of the 15
examples in the K project, all but three have 114T. A third of them have
16223T. Since this is one of Behar's
"Ashkenazi" subclades, it is not surprising
that half list eastern European countries. Two of those without 114T list
Ireland and Ohio. The third one has both 16223T and 16234T, so it’s lack of 114T is probably due to a back mutation. Two
project members have said that they have no known Ashkenazi ancestors.
William
R. Hurst