MTDNA HAPLOGROUP K CHARTS AND MAP FROM 750 MITOSEARCH ENTRIES
Presented here are ten new phylogenetic charts based on the data from the 333 high-resolution (HVR1 plus HVR2) mtDNA haplogroup K entries on FTDNA’s MitoSearch when it reached a total of 750 entries. Earlier discussion of the material may be seen here. Nine of the diagrams were produced using Fluxus-Engineering software with data input from Tom Glad’s mtDNAtool. For most of them I used the Median Joining Network Calculations method. An exception will be noted below. The tenth chart was created using PowerPoint. Note that there are now 775 K entries on MitoSearch.
In addition, there is one new map showing the European origins of five K subclades, also created in PowerPoint from the same MitoSearch data.
Referred to often below is the 2006 paper on Ashkenazi Jewish mtDNA by Dr. Doron Behar, now the Chief mtDNA Scientist at FTDNA. That paper has a chart which defines the subclades of haplogroup K. Most subclades are defined by coding-region (CR) mutations which are outside the HVR regions found on MitoSearch. However, some subclades are defined at least partially by HVR mutations or may be predicted from those mutations.
The Fluxus diagrams are based on various combinations of five HVR2 mutations, 114T, 146C, 152C, 195C and 497T, which were used by Behar in his definitions. Most of these are recurrent mutations; that is, they occur in more than one place on the K chart. They are not usually recent random mutations; they are usually thousands of years old. The exception to the above is 497T, which is very close to being similar to Y-DNA’s UEPs (Unique Event Polymorphisms). But in general, even mutations which define subclades may show up in another subclade as a random or personal mutation. I will point those out. In most cases where Fluxus has suggested alternate routes, I have deleted the least likely one.
For each diagram, you should start with the node marked “KROOT,” which represents the original K’s “basic six mutations”: 16224C, 16311C, 16519C, 73G, 263G, and 315.1C. On some diagrams I have helpfully colored that node blue. It is always found on either the left side or in a corner. The other nodes are proportional to the number of exact entries represented and are labeled by the first MitoSearch entry involved. The order of the nodes from the Kroot is meant to be in chronological order. However, there are often alternate ways to draw the charts. Fluxus has no magical way to determine the order or age of the mutations or nodes. The list of mutations between nodes is not in chronological order.
Most of groupings on the chart are not officially subclades (also called subhaplogroups), so I call them “haplotype clusters.” Each cluster usually consists of a “perfect haplotype” – the basic six mutations plus the mutations specific to that chart – and haplotypes with additional mutations.
I have discussed the HVR2 position 524 insertions previously. I recently learned that the Sorenson Molecular Genealogy Foundation (SMGF) always uses the form 524.1A, 524.2C, etc., based on a Wilson paper. The majority of FTDNA entries use the reverse, 524.1C, 524.2A, etc. On the several charts where both versions occur I have normalized them by simply deleting the letters, using 524.1, 524.2, etc. In at least one case, a perceived genetic difference of eight becomes an exact match! I have also discussed previously my practice of counting each pair of these insertions as a single mutation, especially in determining genetic distance. Behar did not use the 524 insertions when creating his K chart, probably for two reasons. One, being very recurrent they make a phylogenetic chart much more complicated. Two, they don’t occur in the three Ashkenazi subclades, at least not that I have found on MitoSearch or in the K Project. They also don’t occur (with one known exception) in the K1c/K1c2 and some other subclades. As I have said: “Recurrent but not random.” However, 21% of K haplotypes contain at least one pair of these insertions. According to the SMGF Top 50 Mutations list, they only appear in 5% of mtDNA haplotypes overall.
CHARTS AND MAP
497T:
This haplotype cluster contains the basic six K mutations plus 497T, but not
HVR2 mutations 114T, 146C, 152C or 195C. Mutation 497T, which defines subclade
K1a, was probably the first to occur after the founding of K. This complex
diagram features a star pattern, with several subsidiary stars and branches.
There are three examples of the perfect haplotype on MitoSearch, from
146C:
Behar uses 146C, probably the next oldest mutation after 497T, to define
subclade
146C-497T:
This cluster combines the two earliest mutations and also shows a branching
pattern. There are no perfect examples. Interestingly, while there are 13
examples of this combination on MitoSearch, it does not appear on Behar’s chart. Three entries trace back to
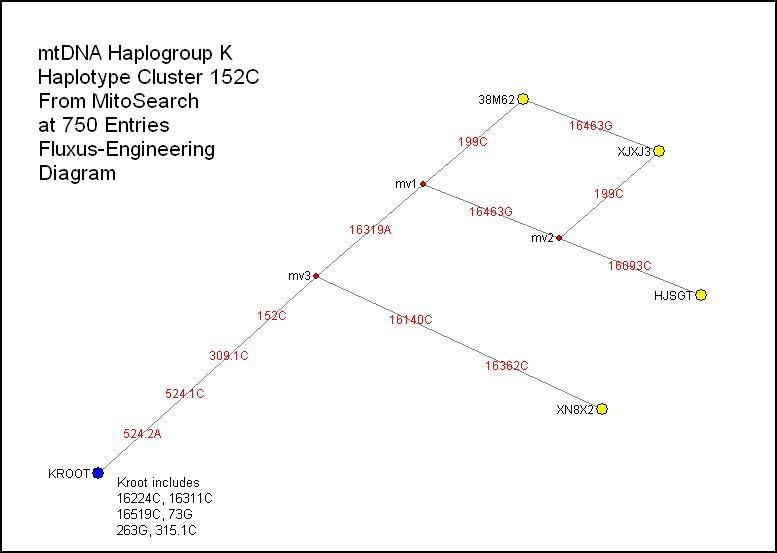
152C:
Standing alone, this mutation starts a small cluster with almost as many
branching points as nodes. There are no perfect examples. I have deliberately
left in a pair of alternate routes, although I would lean toward eliminating
the line from 38M62 to XJXJ3. Only two of the four list countries of origin:
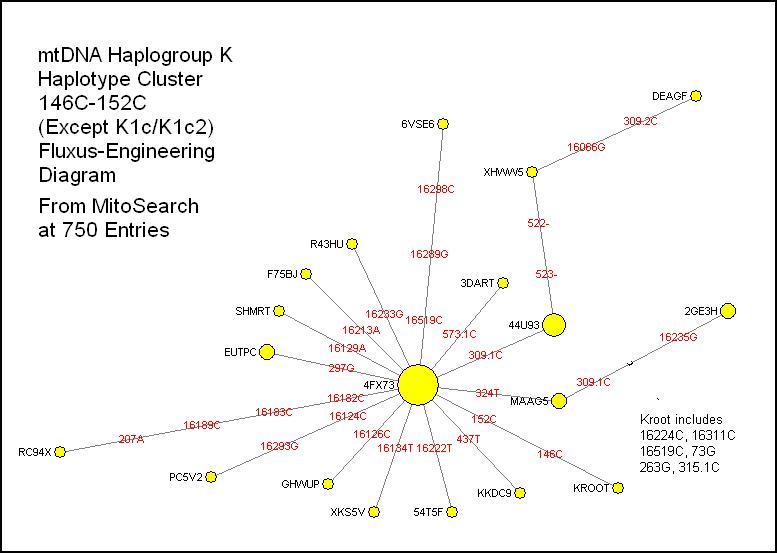
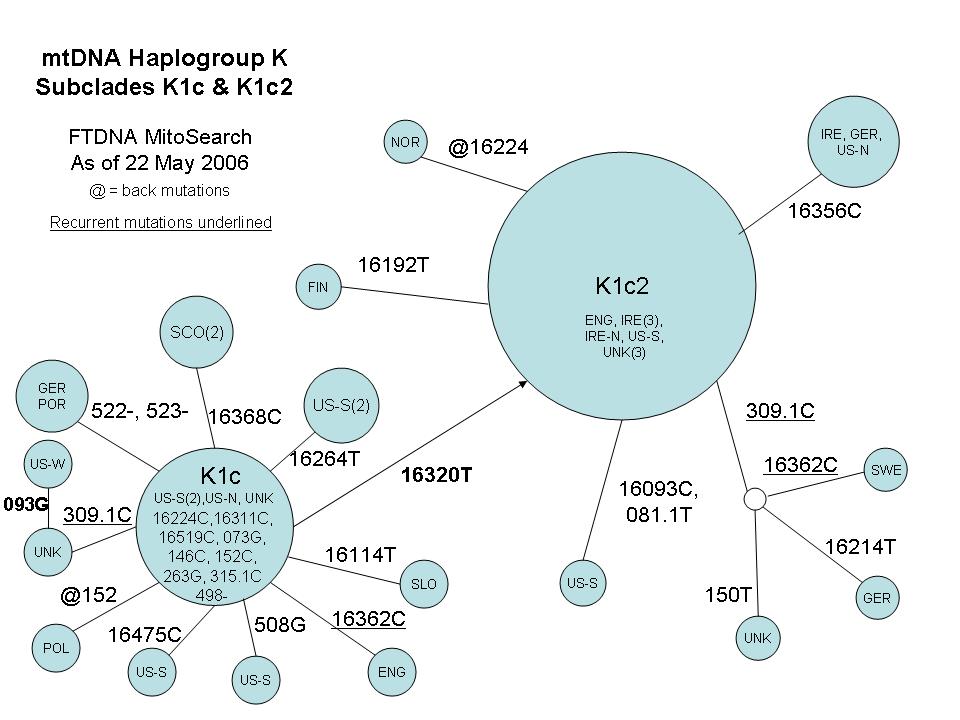
146C-152C:
Behar uses this combination, with some CR mutations, to define K2a, and with
498- to define K1c. I discussed this either/or
situation recently and published a combined Fluxus chart
based on K Project members. This new diagram omits all the entries in K1c and
K1c2 (defined by adding 16320T). I did a PowerPoint chart
for those subclades back in May. This large cluster exhibits a star pattern
radiating from a large node representing a dozen perfect examples,
well-distributed back to
152C-497T:
A fairly large branching cluster with no perfect examples, this is another
branch of the K1a subclade. Members trace back to
146C-195C:
A fairly large branching cluster with no perfect examples, there are three tracing
back to
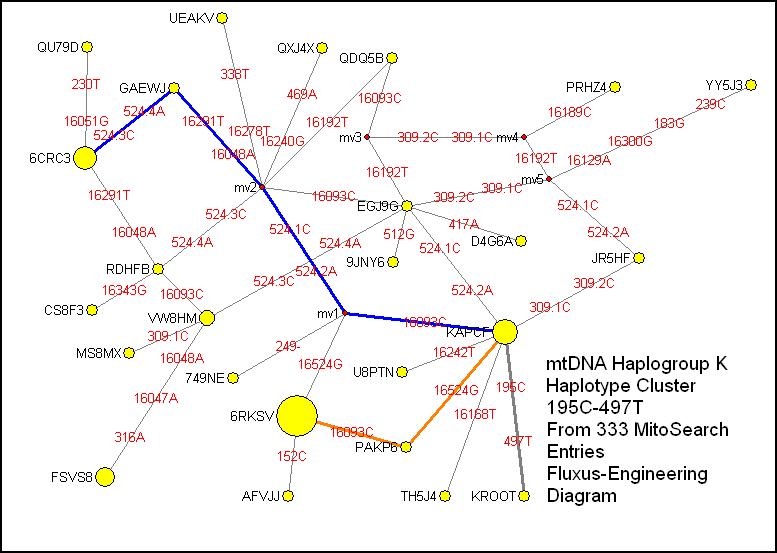
195C-497T:
I have left this diagram pretty much unedited to show how complicated a large
diagram can look straight out of Fluxus. Shown are several alternate routes and
one set of lines that cross but do not connect. There are five perfect
examples, one tracing back to
114T:
Actually all entries in this cluster also contain 497T, but it does not include
those in the largest Ashkenazi subclade K1a1b1a. Most 114T mutations are found
there, where it is shown below mutation 16234T, which defines the subclade.
Most entries in that subclade on MitoSearch have 114T. Two members of the K
Project have been designated as K1a1b1a; both have 114T. Also, Behar’s chart has 114T in subclade K1a1a in
conjunction with several CR mutations and 16093C and in subclade K1a1b along
with 152C and several CR mutations. Here there are examples of the first of
those combinations and others, with origins scattered around the British Isles,
16048A:
As a change-up, this haplotype cluster is defined by an HVR1 mutation. It is
included in the diagram for 195C-497T above, but it appears distinctive enough
and large enough to be entitled to its own cluster. Also, the Fluxus software
resists what I think is the proper alignment. So I went back to PowerPoint,
which I used for such charts before Tom Glad made available his utility to
create Fluxus import files. This cluster has two main branches. Sticking with
the HVR1 theme, I call them the 16291T and 16047A branches, with the former
being the larger. So far there is only one example at the first node GAEWF.
Since that entry traces back to
Ashkenazi-K1c/K1c2
Map: Now for something completely different, this is a map showing the
European origins of the three Ashkenazi subclades – K1a1b1a, K1a9, and
K2a2a - contrasted with those of the K1c and K1c2 subclades. The East-West
division is clear, with
Finally, all K’s are encouraged to join the K Project by clicking on the blue Join button on their FTDNA personal page.
William R. Hurst
Group Administrator, mtDNA Haplogroup K Project.