Fluxus Network Diagrams for K Subclades
From MitoSearch at 1000 Entries
The five charts discussed below were
produced using Fluxus-Engineering Network software. The more complicated
ones were run through the Reduced Median then the Median Joining algorithms. In
each chart, KROOT represents the ancestral K haplotype with HVR mutations
16224C, 16311C, 16519C, 73G, 263G and 315.1C. If one of those six mutations
appears otherwise on a chart, that would represent a back mutation. If any
other mutation appears more than once between KROOT and the end node, that
would also represent a back mutation. However, the latter type of back mutation
may just represent a placement decision by Fluxus which may or may not reflect
reality. In the interest of sanity, I have not marked these back mutations on
the charts; but I have discussed many of them below. The six charts include one
each for three of the major K subclades, K1b, K1c and
K1a
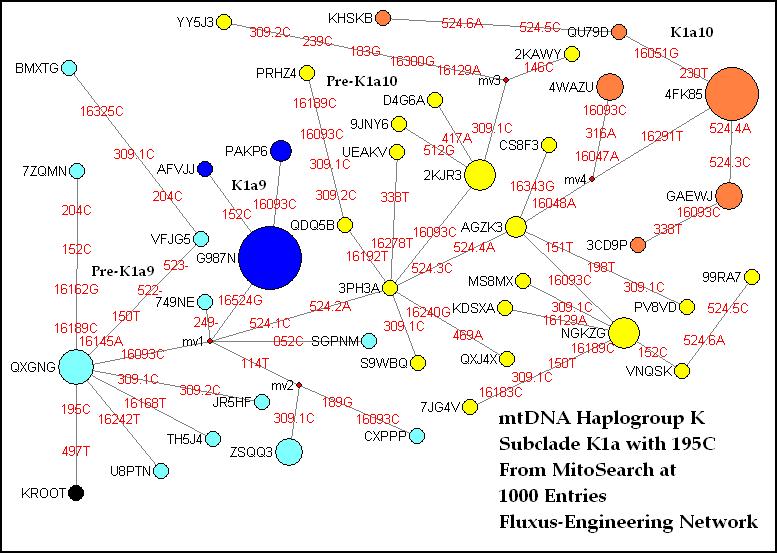
plus 195C: This
chart includes all K haplotypes with 497T, the defining mutation for the large
subclade K1a, plus 195C. This group not only includes the Ashkenazi subclade
K1a9 defined by 16524G, but also a large cluster defined by 16048A, to which
I've given the temporary name K1a10. In addition, I've given the temporary
names Pre-K1a10 and Pre-K1a9 to clusters of haplotypes with and without pairs
of 524 insertions. K1a10 has 524 insertions, while K1a9 does not. For this
chart all mutations are used. The position 309 insertions are important since
they appear in Pre-K1a9 and Pre-K1a10, but never in K1a9 or K1a10. Although
this K1a/195C group was only 8.5% of the sequences upon which Dr. Doron Behar's
K chart was based, it included 19% of the K entries on MitoSearch.
Beginning at KROOT, the line goes up
via 497T and 195C to the first large node QXGNG which represents five matching
sequences with the modal value of Pre-K1a9. There are 10 other sequences in a
mostly star pattern around that node. As I have said before, I'm not sure the
ones with 114T belong here, since that mutation is usually found in the K1a1+
lines. Note that all the remaining sequences follow the line via 16093C to
branching point mv1 and beyond. That mutation is a heteroplasmic one, often
called a hotspot, so the diagram may or may not reflect reality. The
branch up from mv1 is K1a9, defined by 16524G. The modal node G987N is the
largest on the chart, representing 16 sequences. The two-sequence node PAKP6
shows a back mutation on 16093C. Behar's K chart shows 16093C below 16524G and
K1a9. Both sequence orders may have actually occurred. If K1a9 appears to
branch off the main line of the chart, it also branched off geographically,
since it is found mostly in
The line to the right from mv1 moves
through the first pair of position 524 insertions to 3PH3A, the beginning of
Pre-K1a10. This cluster includes five sequences in a star pattern, three more
at 2KJR3 which have dropped (or never had) 16093C, then a couple more off that
node. From 3PH3A past a second pair of 524 insertions leads to AGZK3, which has
branches to many more in Pre-K1a9. The large four-sequence node NGKZG and five
other singletons are without 16093C.
From AGZK3 to mv4 and beyond is
K1a10, defined by 16048A. The first branch up from mv4 is via two new mutations
and a dropped 16093C to a three-sequence node 4WAZU. But it's from mv4 via
16291T which leads to the 11-sequence node 4FK85, the modal for K1a10.
Especially interesting is that Fluxus has shown the sequences in this cluster
with only two pairs of 524s - the three-sequence GAEWJ and 3CD9P - as back
mutations from the larger two-pair modal node. I've suggested before that this
might have been the proper order of events, but I'm a little surprised that I
was able - not on purpose - to produce a diagram representing it. The solution
was to include K1a10 as a branch of Pre-K1a10, which, of course, is part of the
theory I've suggested. In other words, the original 16048A mutation occurred in
a person in Pre-K1a10 who already had two pairs of 524s. The most distant node
KHSKB, with a third pair of 524s, is the record-holder in K with 19 differences
from the CRS, including six non-heteroplasmic mutations since the founding of
K.
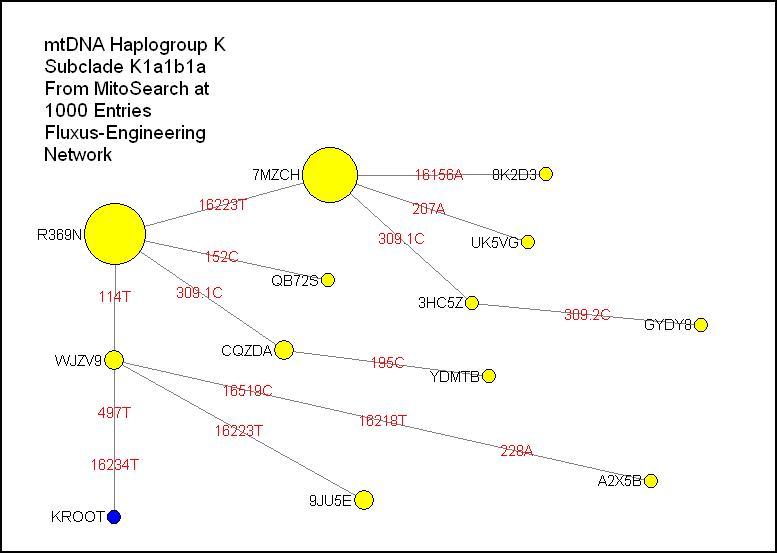
K1a1b1a:
A vastly less
complicated chart than the one above, this chart is of the largest Ashkenazi
subclade defined by 16234T. The modal node R369N also includes 114T. A second
large node picks up 16223T. One sequence has a rare back mutation on 16519C.
Note that none of the Ashkenazi subclades have 524 insertions.
K1b:
K1b is defined by a
coding-region mutation, but two of its lower subclades may be identified by HVR
mutations. From KROOT directly to the right and to the lower right of mv4,
there are several sequences which do not have defining HVR mutations. These are
shown as K1b+, but most are probably K1b1. Note that all levels of K1b have
sequences with and without 524 insertions. Up from mv4 is K1b1a, defined by
16319A and 152C. Most of those also have 16463G. There are sequences with and
without 16093C. Also, many have back mutations at position 524, or never had
them. To the upper right of mv4 is K1b2, defined by 146C and 195C. This
subclade has a second large node with 16129A, but without 524s – shown here by
back mutations. K1b2 has the greatest number of variants in K of the 524
insertion pairs, from zero to three pairs.
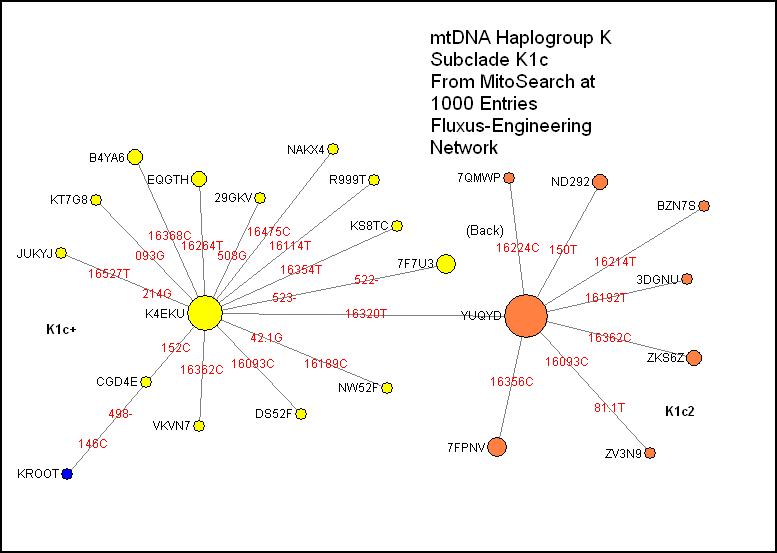
K1c:
With another simple
chart, K1c is defined mainly by 498-, a deletion only found in haplogroups K
and L0. All have 146C and all but one has 152C, which in reality is probably a
back mutation for CGD4E. From the modal node K4EKU, there is a classic star
pattern. Most of these are probably in K1c1 and lower subclades, but those are
defined by coding-region mutations. To the right, K1c2 is defined by 16320T,
again with a large modal node and a star pattern. One sequence has a rare back
mutation on the key K mutation 16224C. Note that none of the sequences here has
524 insertions, although two related persons in the K Project do have them in
an otherwise unusual sequence. In fact, node 7F7U3 has a pair of deletions at
522 and 523 which in effect represent “below zero” in the line of C nucleotides
which include position 524.
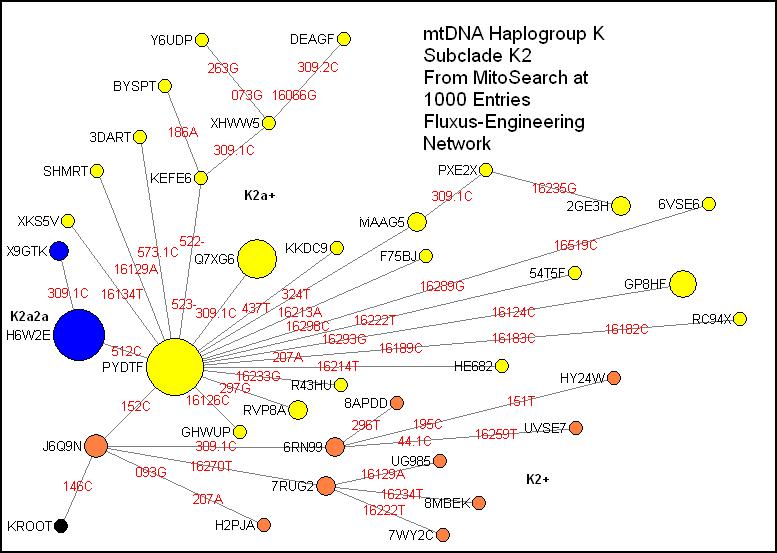
K2:
This subclade starts
with 146C; to the right are many nodes in a tree-like structure. The group is
marked
©2007
William R. Hurst
Administrator,
mtDNA Haplogroup K Project