|
 what's in a name? Where & When ... Temporal & Geographic Distribution
|
Building a DNA Family Tree - using your genes to trace your ancestors back Right! Let's take stock! If we suppose that several people have joined your project (they have), each of them have received their results which have also been posted on the website (they have), your results are up there too (they are), and now, you're faced with a gaggle of haplotypes (you are). You can see perhaps that some of them match you exactly, some are off by a marker here or there, and some are not even close to you at all. So ... what do you do next? Let's try and answer that question ... bit by bit ...
Chris Pomery writes an excellent step-by-step guide on how to sort or cluster a varied group of many different haplotypes into distinct genetic families or lineages and I reproduce it here (see http://www.daltongensoc.com/dnaproject/text.html#4):
So the modal haplotype is the sequence of marker values that occur most commonly for each of the markers in the participants tested to date. Although this should reflect the most ancient haplotype from which the various branches of the genetic family have evolved, this may not be the case if the sample is biased by having an "over-representation" of members from one particular family branch. However, it is a good starting point, the assumption being that this is the haplotype from which branched out all the other haplotypes in the group as a whole. Cladograms, Phylograms, & 'Mutation History' Family Trees
It is also possible to use special computer software programmes to generate cladograms, phylograms, or phylogenetic network diagrams. This type of diagram has also been used to map other evolutionary events, such as the evolution of animals, or the more distant changes in Y-DNA (haplogroups) going back to the earliest common male ancestor (in Africa, 60,000 years ago). For some examples of phylograms, see Debbie Kennett's website and there are several videos on how to read phylograms and create your own at Chris Pomery gives a very useful overview of how phylograms can assist traditional genealogy in an very well-produced video He also provides a useful overview of the process of combining genetic genealogy with traditional genealogy The best guidance on how to generate phylograms is provided by David Ewing on the Ewing Surname Y-DNA Project website
The first step in generating a DNA Family Tree is to calculate the haplotype of the MDKA (Most Distant Known Ancestor) for each of the branches in the Family. This is done by a process of 'triangulation', a concept borrowed from trigonometry and geometry. Basically, this process compares the haplotypes of known cousins and if they are identical, then one concludes that the identical DNA has been passed on to both of them via their most recent common ancestor (MRCA). This is taken as confirmation that the haplotype of a pair of cousins has not mutated since the time of their MRCA. Here's how it would work in the Spearin Surname Project:
And that, in essence, is triangulation. A video explanation of triangulation can be found in the section on Interpreting Results. Once the haplotype of the MDKA has been estimated for each of the various branches of the family, it should be possible to work out through a logical process of deduction, which mutation came first, and which mutations followed it. In this way a 'Mutation History' Family Tree can be developed which can be superimposed on top of the paper-based Family Trees (generated by traditional methods). Thus ancestors earlier than each MDKA can be characterised by their mutations, and calculated guestimates can be made regarding the nature of their relationship with other branches. Phylograms can also be generated (to double-check this work) but the software (although freely available on the net) is not user-friendly and defies interpretation by any but the most phylogenetically-orientated minds. Furthermore, they serve as a guide rather than a definitive account of how and when mutations occurred. 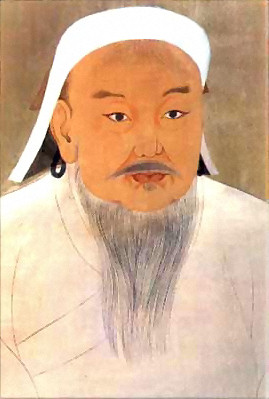
For an interesting discussion of the pros and cons of phylograms vs mutation history trees, see http://www.johnbrobb.com/Content/DNA/MutationHistoryTrees&FluxusDiagrams.pdf. The other drawback is that this modelling exercise is based on probability and uses a 'best fit' approach. The problem here is that there are going to be times when it just doesn't fit i.e. the 'best fit' is not always the correct fit. If anyone can, Genghis can Despite these potential drawbacks, this type of phylogenetic approach has produced some startling revelations. In 2006, an article appeared in the American Journal of Human Genetics reporting that the same Y-chromosome haplotype had been identified in about 8% of men in a large region of Asia (about 0.5% of the male world population). The pattern of variation within the lineage was consistent with the theory that it originated in Mongolia about 1,000 years ago (several generations prior to the birth of Genghis Khan). The rapid spread of the haplotype could not be reliably explained by genetic drift, and it was proposed that it was the result of social selection i.e. the male-line descendants of Genghis Khan and his close male relatives had spread the Y-DNA haplotype throughout Asia due to a) the power that Khan and his direct descendants held, b) polygamy being a social norm, and c) widespread rape in conquered cities. Genghis Khan is believed to have belonged to Haplogroup C3 (see http://web.unife.it/progetti/genetica/Giorgio/PDFfiles/ajhg2003.pdf).The 25 Marker Y-DNA Profile of Genghis Khan according to Family Tree DNA is:
Irish Warlord spreads more than just the word In January 2006, geneticists in Trinity College Dublin suggested that the 5th-century warlord 'Niall of the Nine Hostages' may have been the most fertile male in Irish history. In northwest Ireland as many as 21.5% of men (8.3% in Ireland in total) have the same Y-chromosome haplotype and share a common male line ancestor roughly 1500 years ago. Below is their 25-marker Y-DNA ancestral haplotype, and by extrapolation, the haplotype of Niall of the Nine Hostages. Thus the genetic evidence confirms ancient fables about Niall and suggests that he may be the forefather of approximately 3 million men in the world today (see http://www.ncbi.nlm.nih.gov/pmc/articles/PMC1380239/pdf/AJHGv78p334.pdf). 
|
||||||||||||||||||||||||||||||||||||||||||||||||||||||||||||||||||||||||||||||||||||||||||||||||||||||||||||||||||
|
Join us today ... you could find out more than you ever imagined! Maurice
Gleeson |
|||||||||||||||||||||||||||||||||||||||||||||||||||||||||||||||||||||||||||||||||||||||||||||||||||||||||||||||||||
 Lineages, clusters, genetic families
 Ultimately, it should be
possible to map the earliest haplotype and estimate when and how the other
subgroups branched away from it. This map could be called a 'Mutation History' Family Tree, or a Y-DNA Family Tree, because it traces the 'descendants' of a particular Y-chromosome, but instead of identifying individuals by name and date of birth, it will characterise them by mutations in specific Y-DNA STR markers.
Ultimately, it should be
possible to map the earliest haplotype and estimate when and how the other
subgroups branched away from it. This map could be called a 'Mutation History' Family Tree, or a Y-DNA Family Tree, because it traces the 'descendants' of a particular Y-chromosome, but instead of identifying individuals by name and date of birth, it will characterise them by mutations in specific Y-DNA STR markers. Triangulation